Experiment Reports
Experiment reports are organised into three tabs, each answering a different question about your experimentation programme:
| Tab | What it answers |
|---|---|
| Velocity | How many experiments were started, run and completed? |
| Decisions | What decisions were made as a result of those experiments? |
| Impact | What impact did those experiments have? |
The general settings & filters and report settings described below apply to all three tabs.
General settings & filters
The settings and filter described below apply to all reports.
Dates & filters

Reporting period
At the top of the report users can select the period over which they want to report. By default the reporting period is set to the last 30 days.
Filters
Users can select to report on a subset of experiments based on the following available Filters Owners, Applications, Unit types, Primary metric, Teams and Tags.
By default no filters is selected so the report includes all experiments.
Report settings

Unique experiments vs All iterations
The Unique experiments switch allows to toggle between reporting on unique experiments and reporting on all iterations.
When the toggle is off (default), the reporting is done at the iterations level which means reporting on every single experiment iterations.
When the toggle is on, the reporting is done at the unique experiments level which means reporting on unique experiment names.
For example, if an experiment named Test new check-out flow was started, then aborted after a few minutes because of an issue then restarted once the issue was fixed.
When reporting on iterations, this experiment would be counted twice for started while reporting on unique experiments it would only appear once.
The last instance would be used for the aggregation on the graph.
Sharing
It is possible to generate a shared link of an exact view of the report by clicking on the share button on the right side of the report.
Aggregation type
By default, and when relevant, the data shown on the reports will be aggregated per week but it is also possible to aggregate per month or per year.
Choosing the right aggregation depends mainly on the length or the reporting period and how you wish to visualise the data.
Changing the aggregation period does not impact the data shown.
Velocity report
The Experiment velocity report provides an overview of the experimentation program.
It highlights how many experiments were started, running, completed and not completed in the reporting period.
This report can be used to understand how the experimentation program is growing in terms of experiments started.
More importantly it shows how many experiments were successfully completed (vs aborted or early Full on).
Only completed experiments can provide the evidence for making reliable and data-informed decisions.
Permissions
Access to the velocity report requires the permission Experiment reports > View velocity.
If you wish to access the report but do not have permissions please reach out to your platform admin so they can grant you access.
Experiment started
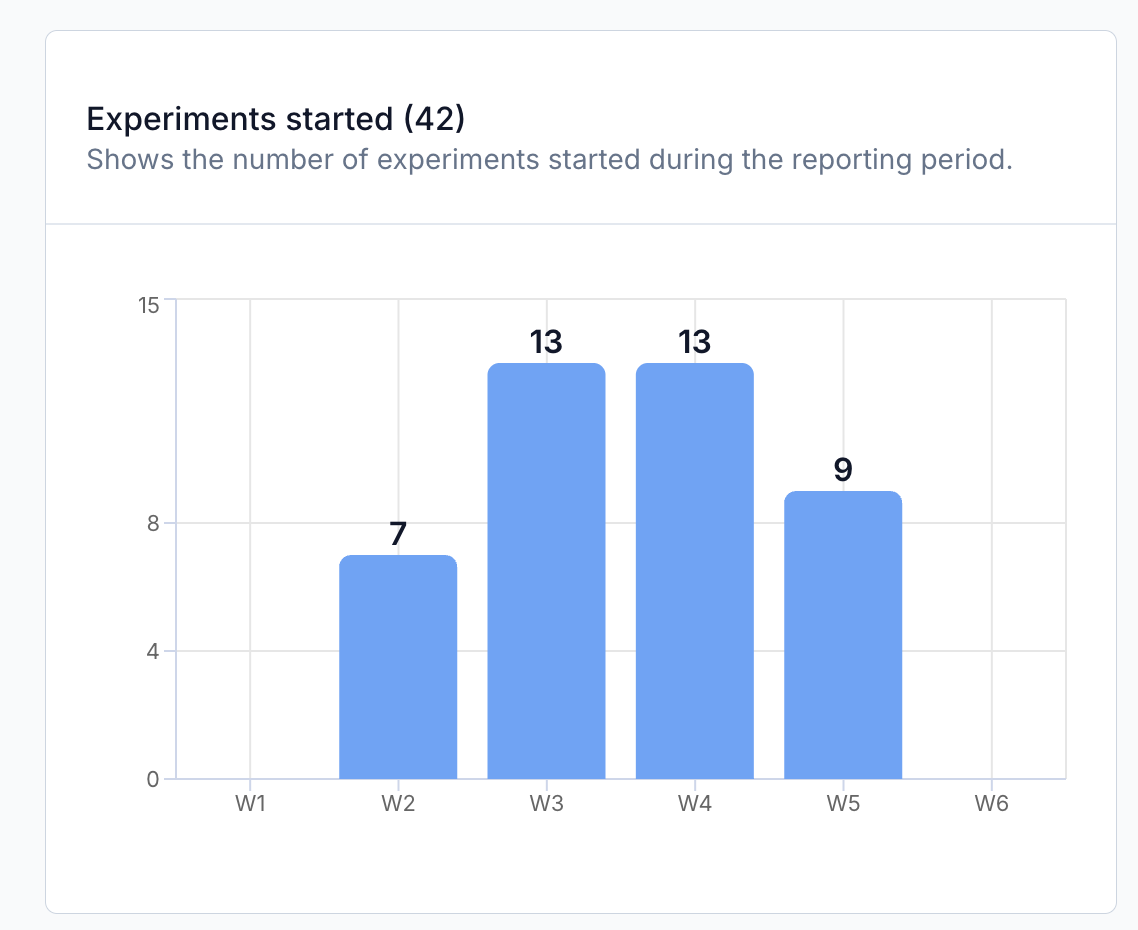
This widget provides a view on how many new experiments were started in the reporting period.
If the same experiment is restarted several times in the reporting period it would appear several times if reporting on Iterations or once if reporting on unique experiment name.
Experiment running
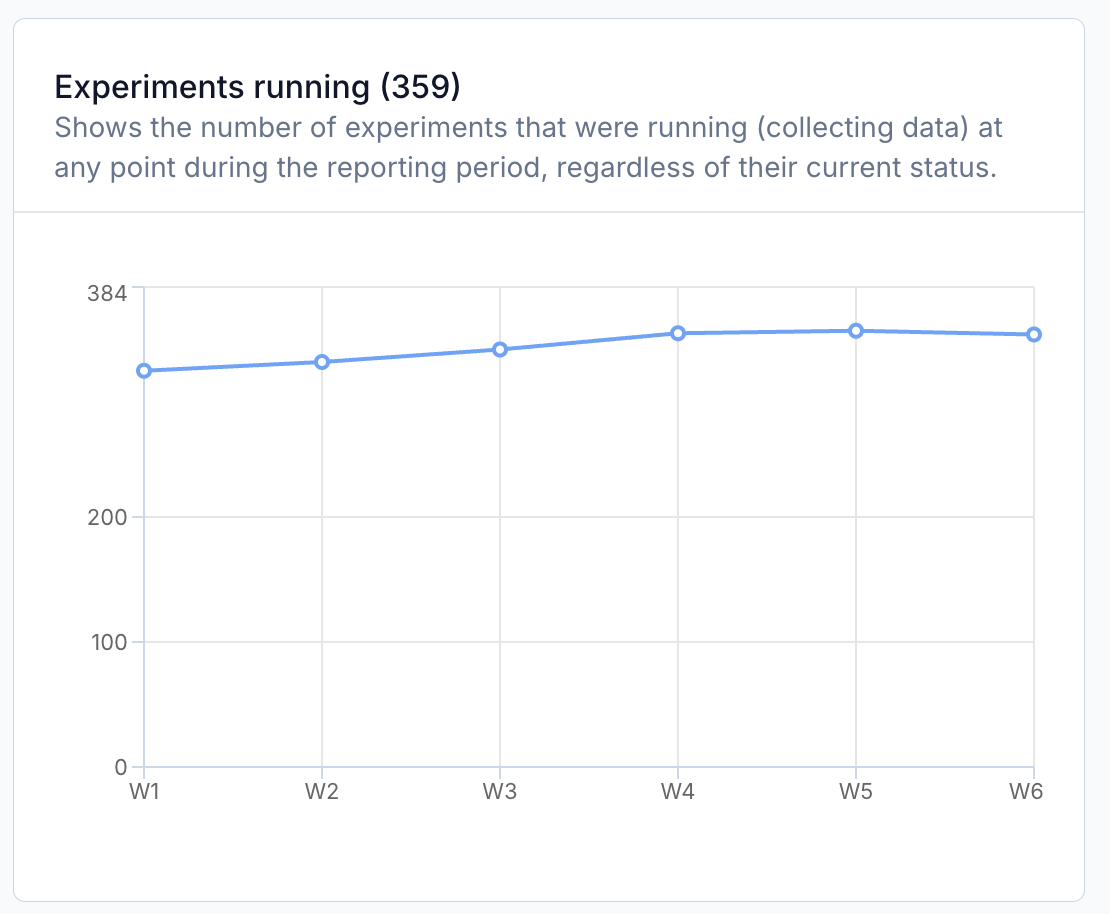
This widget reports on experiments which were running (in progress and collecting data) for any duration in the reporting period. Even if an experiment was running only for a few seconds it would appear on the report.
Experiment completed
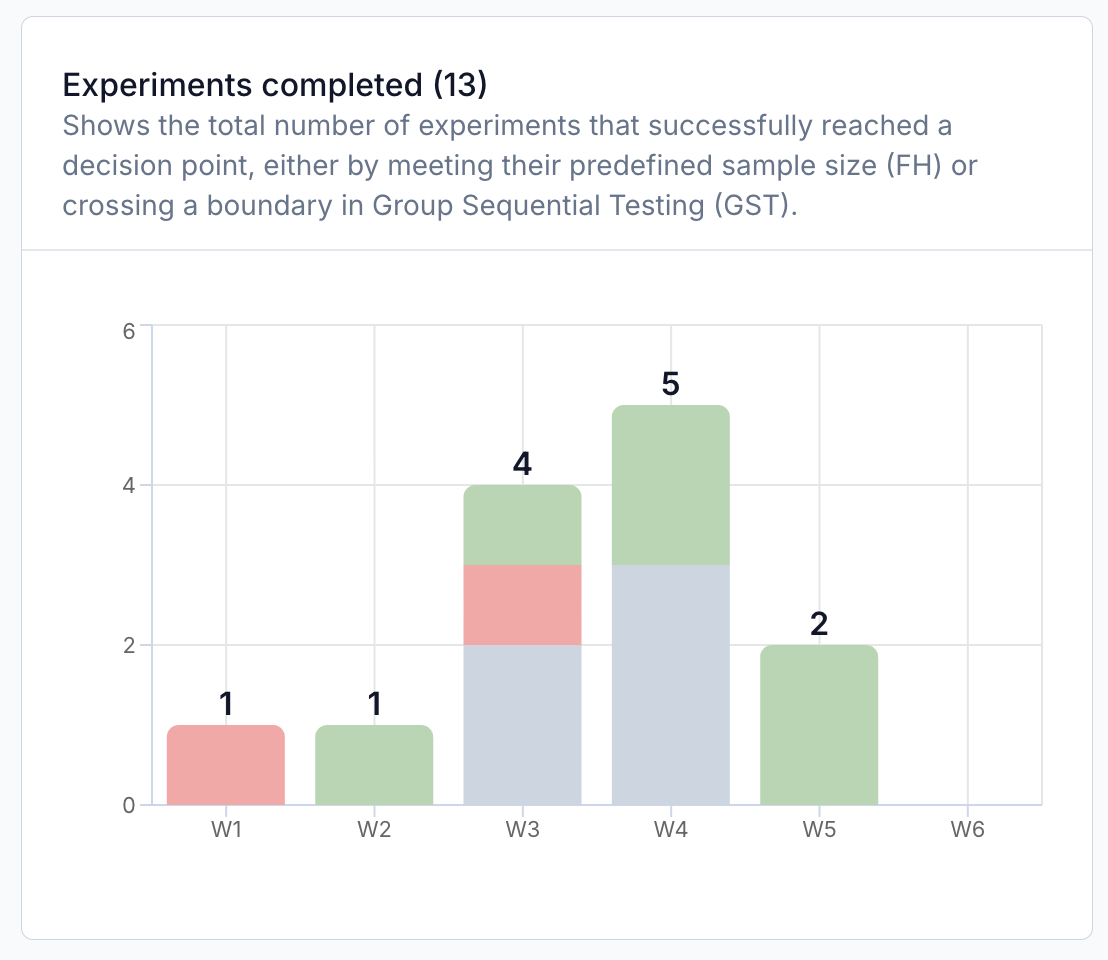
This report highlights the number of experiment which were successfully completed in the reporting period. In the case of a Fixed Horizon Experiment, it is deemed completed once it reaches its expected sample size or planned duration. For a Group Sequential Test, an experiment is completed once it crosses one of the test boundaries (efficiency or futility).
The report also visualises the outcome of the statistical test on the primary metric at the moment the experiment was completed.
The experiment will be shown in green if its primary metric was significant in the expected direction at the time the experiment was completed.
The experiment would be shown in grey if its primary metric was insignificant when the experiment was completed.
In the case of a Fixed Horizon experiment, it can also be shown in red if its primary metric was significant in the opposite direction (causing harm).
Experimentation is about generating evidence to make better decisions. All completed experiments, independently of their statistical outcome,
provide valuable evidence and insights on which to base decisions, and in that sense they should all be seen as success.
Knowing that something does not have the expected impact on customer behaviour can be as important and insightful as validating that something else does.
Experiment not completed
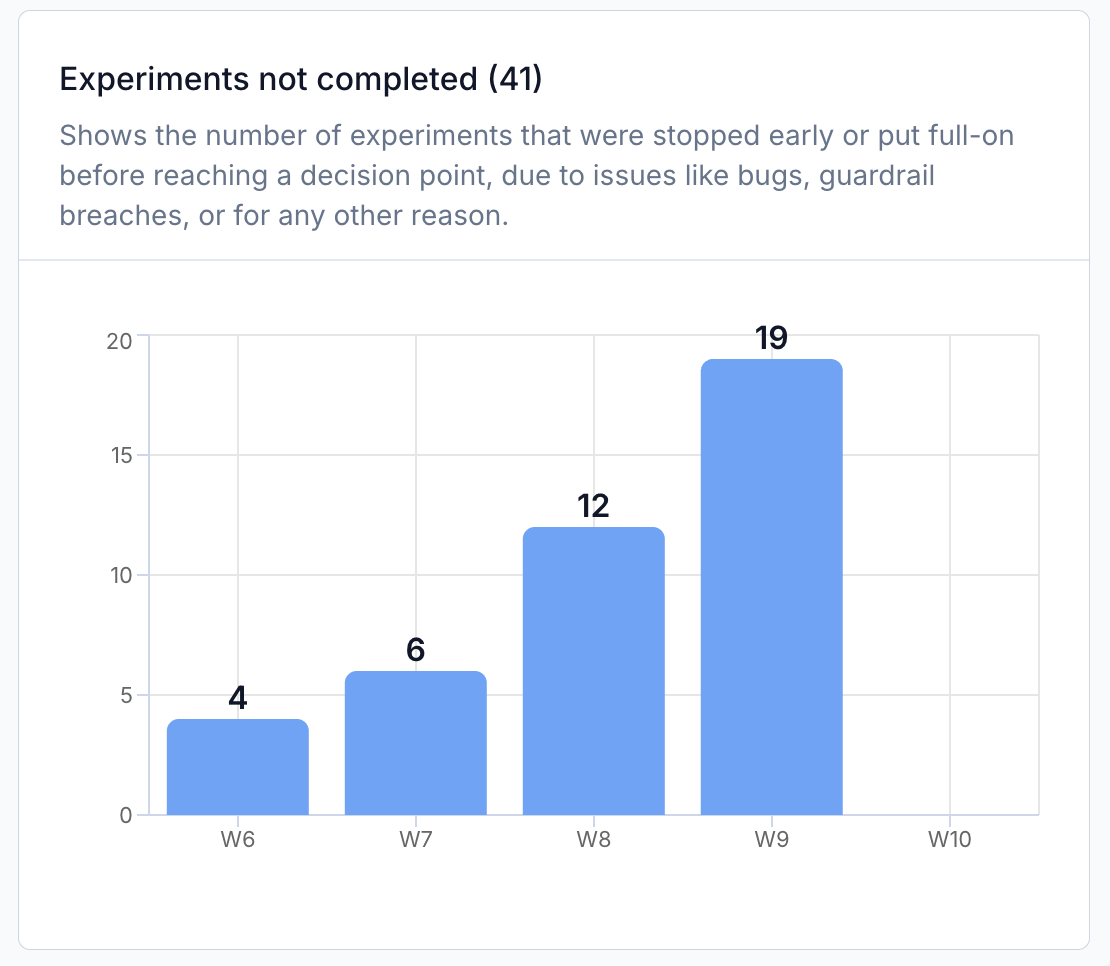
Experiment not completed shows experiments which were stopped or put Full on before they were completed.
In the case of early stopped experiments (also known as aborted experiments), the decisions to abort can happen because of bugs in the implementation, early worrying negative signals, strategic reasons or for any other reason. Depending on the reason for early stopping, aborted experiments are typically restarted once the underlying issue is fixed. Read our When to abort an experiment? guide to understand more about aborting experiments.
While aborting experiments is common and part of the process, early Full on, should be rare as they indicate that changes were pushed without supporting evidence. This can sometimes happen for strategic or legal reasons but because the experiment did not complete, it does not provide the reliable evidence needed to support or discard the underlying hypothesis.
Experiment completion rate
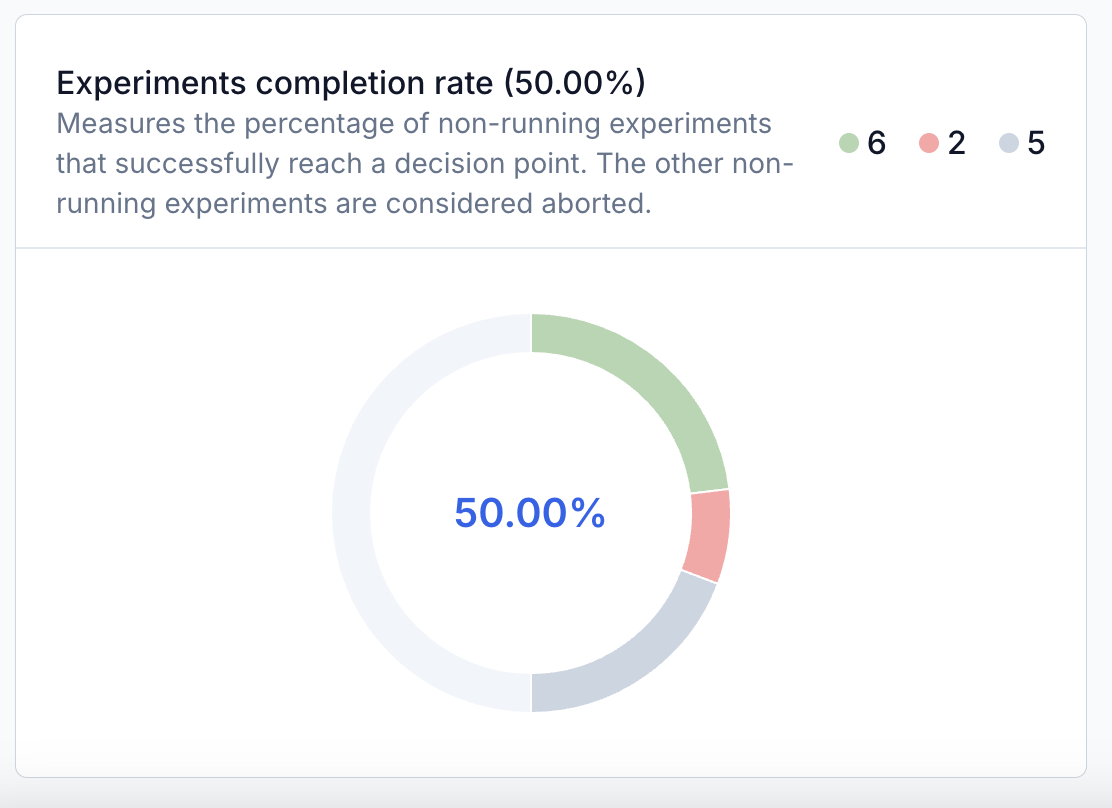
This report shows the ratio of non-running experiments (completed + early Full on + aborted) which were completed in the reporting period. This provides a good overview of the quality of the experimentation program and decisions which are based on those experiments.
Decisions report
The Decisions report provides an overview of decisions made by experimenters as a result of their experiments.
Possible decisions types included in the report are Full on where a tested change is fully rolled out with or without full supporting evidence;
Keep current where the tested change is not rolled out, and the existing experience remains;
and Abort where it was decided to stop the experiment before it could provide reliable evidence.
The tab contains two views: the Decisions overview, which aggregates decisions by type over the reporting period, and the Decisions history, which lists those same decisions as a timeline.
Permissions
Access to the decisions report requires the permission Experiment reports > View decisions.
If you wish to access the report but do not have permissions please reach out to your platform admin so they can grant you access.
Decisions overview
The Decisions overview report provides an overview of decisions made by experimenters as a result of their experiments.
Full on
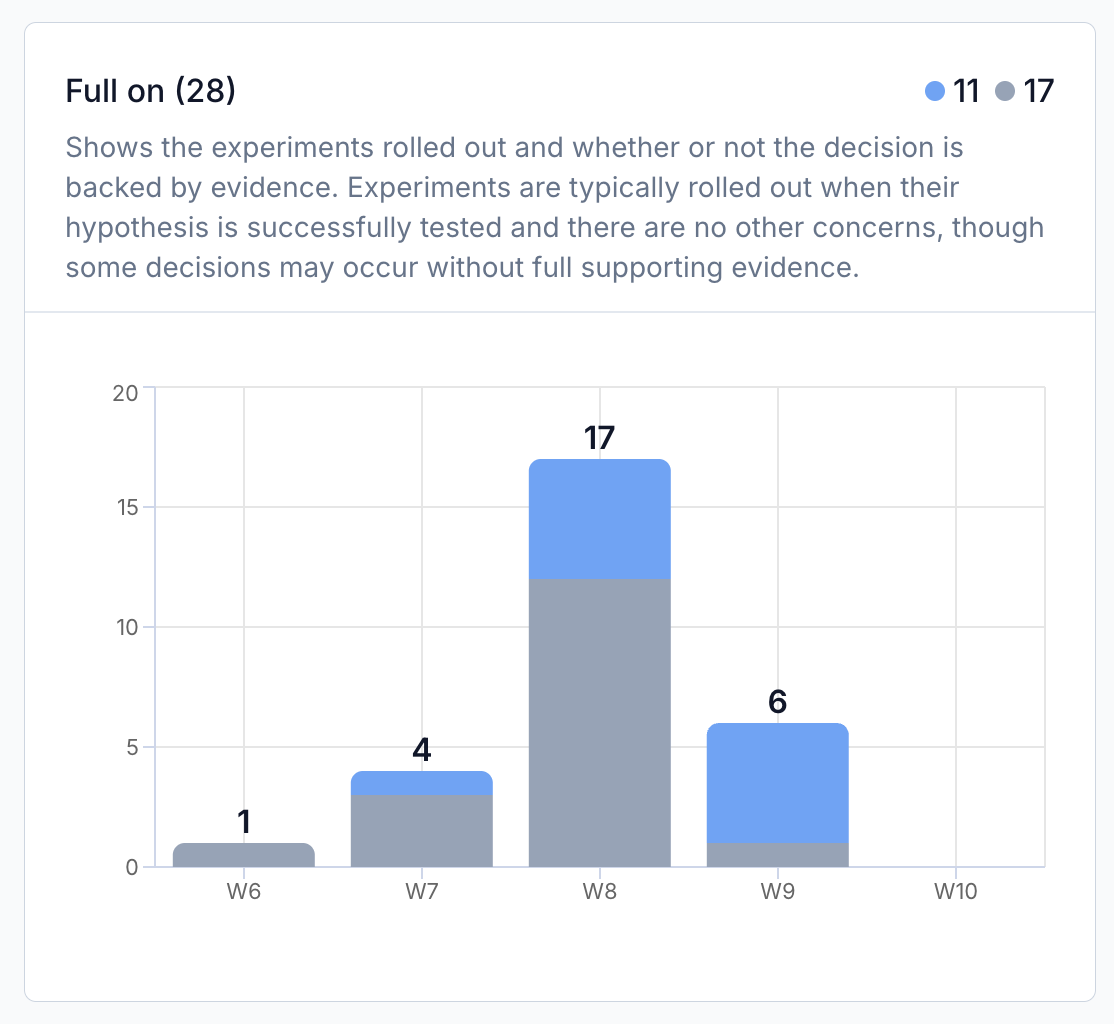
This widget provides a view on how many Full on decisions were made in the reporting period. A Full on decisions means that the tested change was
fully rolled out. Full on decisions are typically made when an experiments is completed and the evidence supports the decision (ie: the primary metrics shows an increase in the expected direction, no red flag, no health checks violation, etc).
It is nonetheless possible for Full on decisions to not be fully supported by evidences (ie: experiment not completed, primary metric not significant, etc).
Full on decisions are shown in blue if they are supported by evidence and in grey is they are not fully supported by evidence.
Currently a Full on decision is shown as supported by evidence if and only if the experiment was completed and the primary metric is significant in the expected direction.
The supported by evidence validation does not currently include checks on the secondary and guardrail metrics nor on the experiment health checks.
Keep current
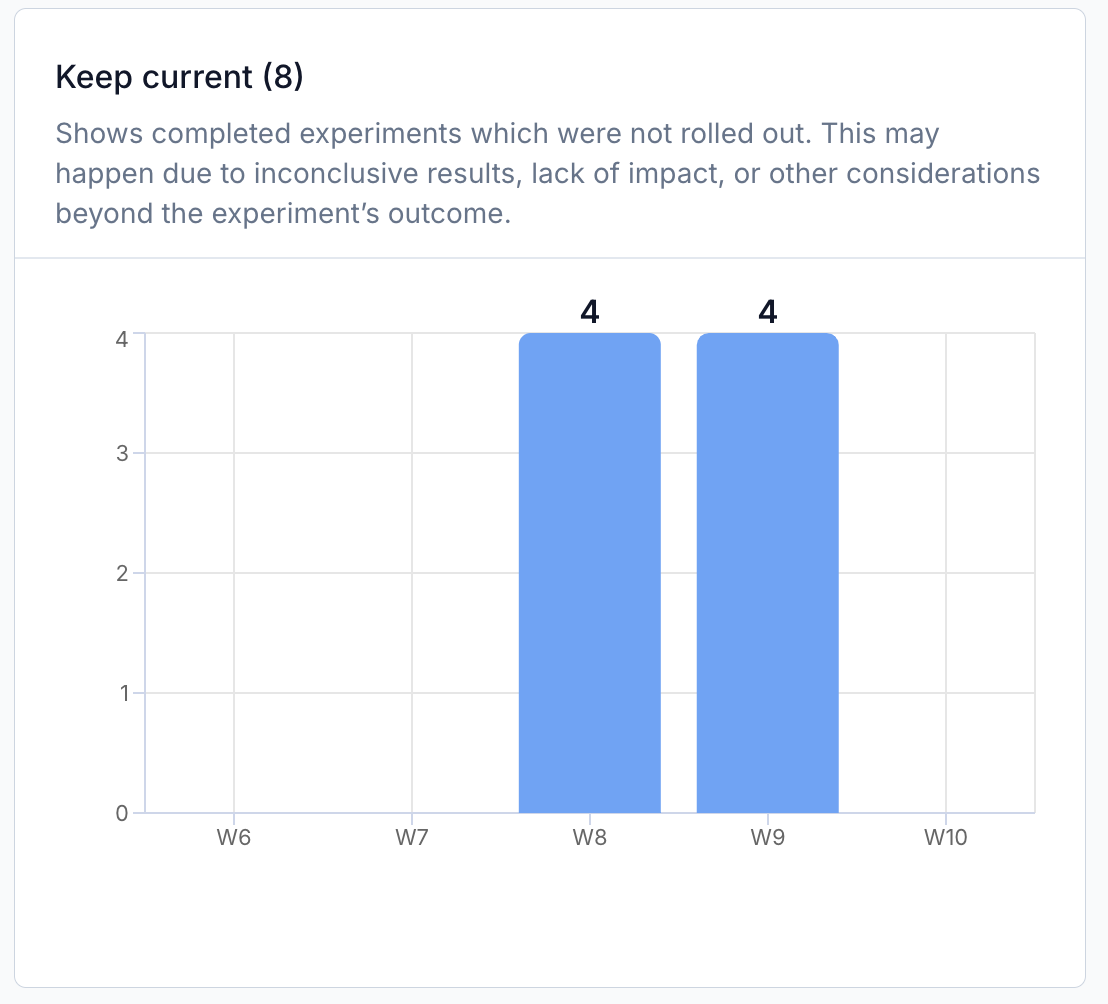
This widget provides a view on how many Keep current decisions were made in the reporting period.
Keep current means that the change was not rolled out and that the current experience (Base) remains.
Keep current decisions means that the experiment was completed but it was decided not to roll it out.
This typically happens when the evidence does not support the hypothesis.
Abort
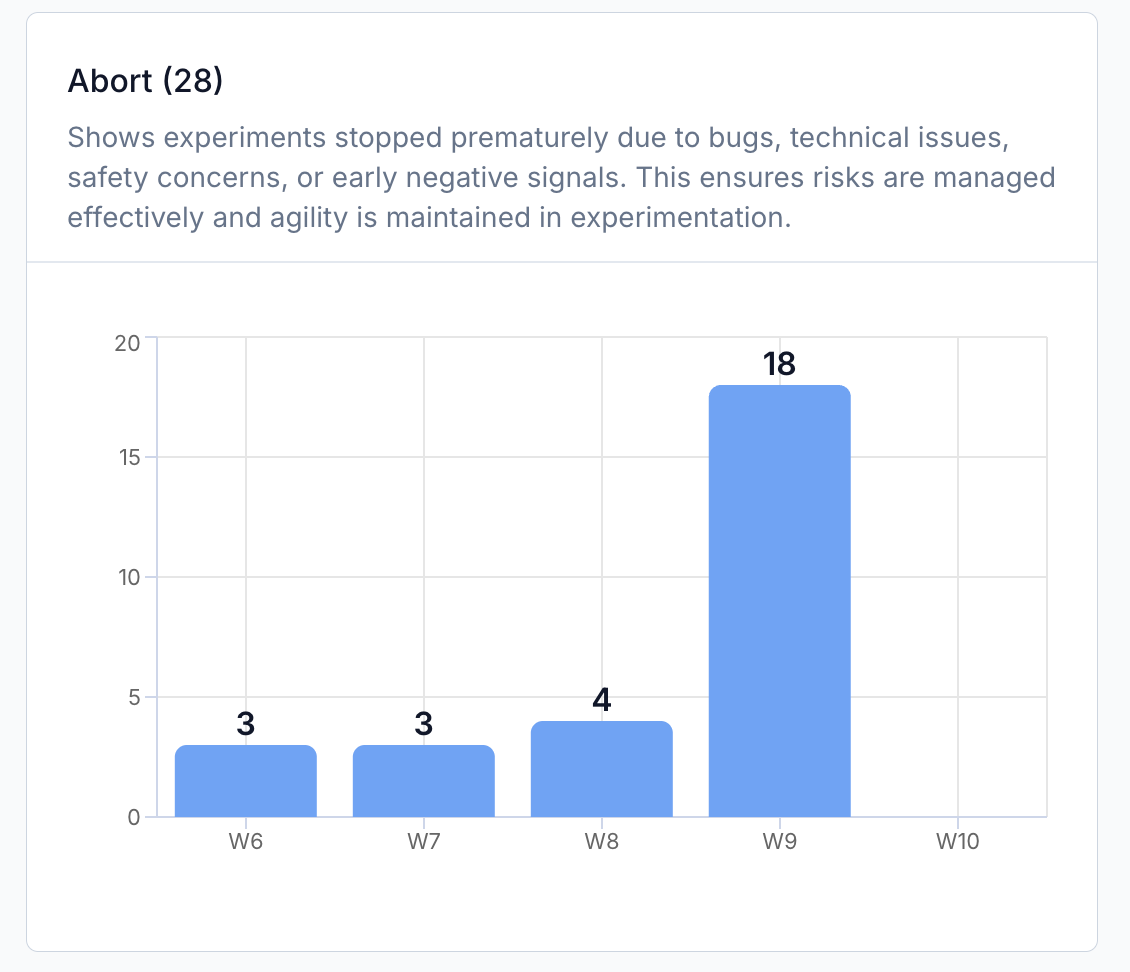
This widget provides a view on how many Abort decisions were made in the reporting period.
Aborting means stopping an experiment before it is completed. Aborting can happen when a bug is found or
when early negative signals indicate a possible degradation in certain key metrics but it could also be a strategic choice to stop early.
Read our When to abort an experiment? guide to understand more about aborting experiments.
Like with Keep current decisions, Abort decisons means that the current experience remains but unlike Keep current decisions it does not say anything about the hypothesis being tested or not.
Decisions history
The Decisions history provides a timeline of decisions overtime.
This report can be used to browse through past decisions to understand the reasoning behind each of them.
Filter
The Decision type filter allows to select the type of decisions to show on the timeline.
Decision card
Each decision card provides an overview of the past decisions, highlighting the hypothesis, the rational behind the decision and the key metrics supporting the decision.
Impact report
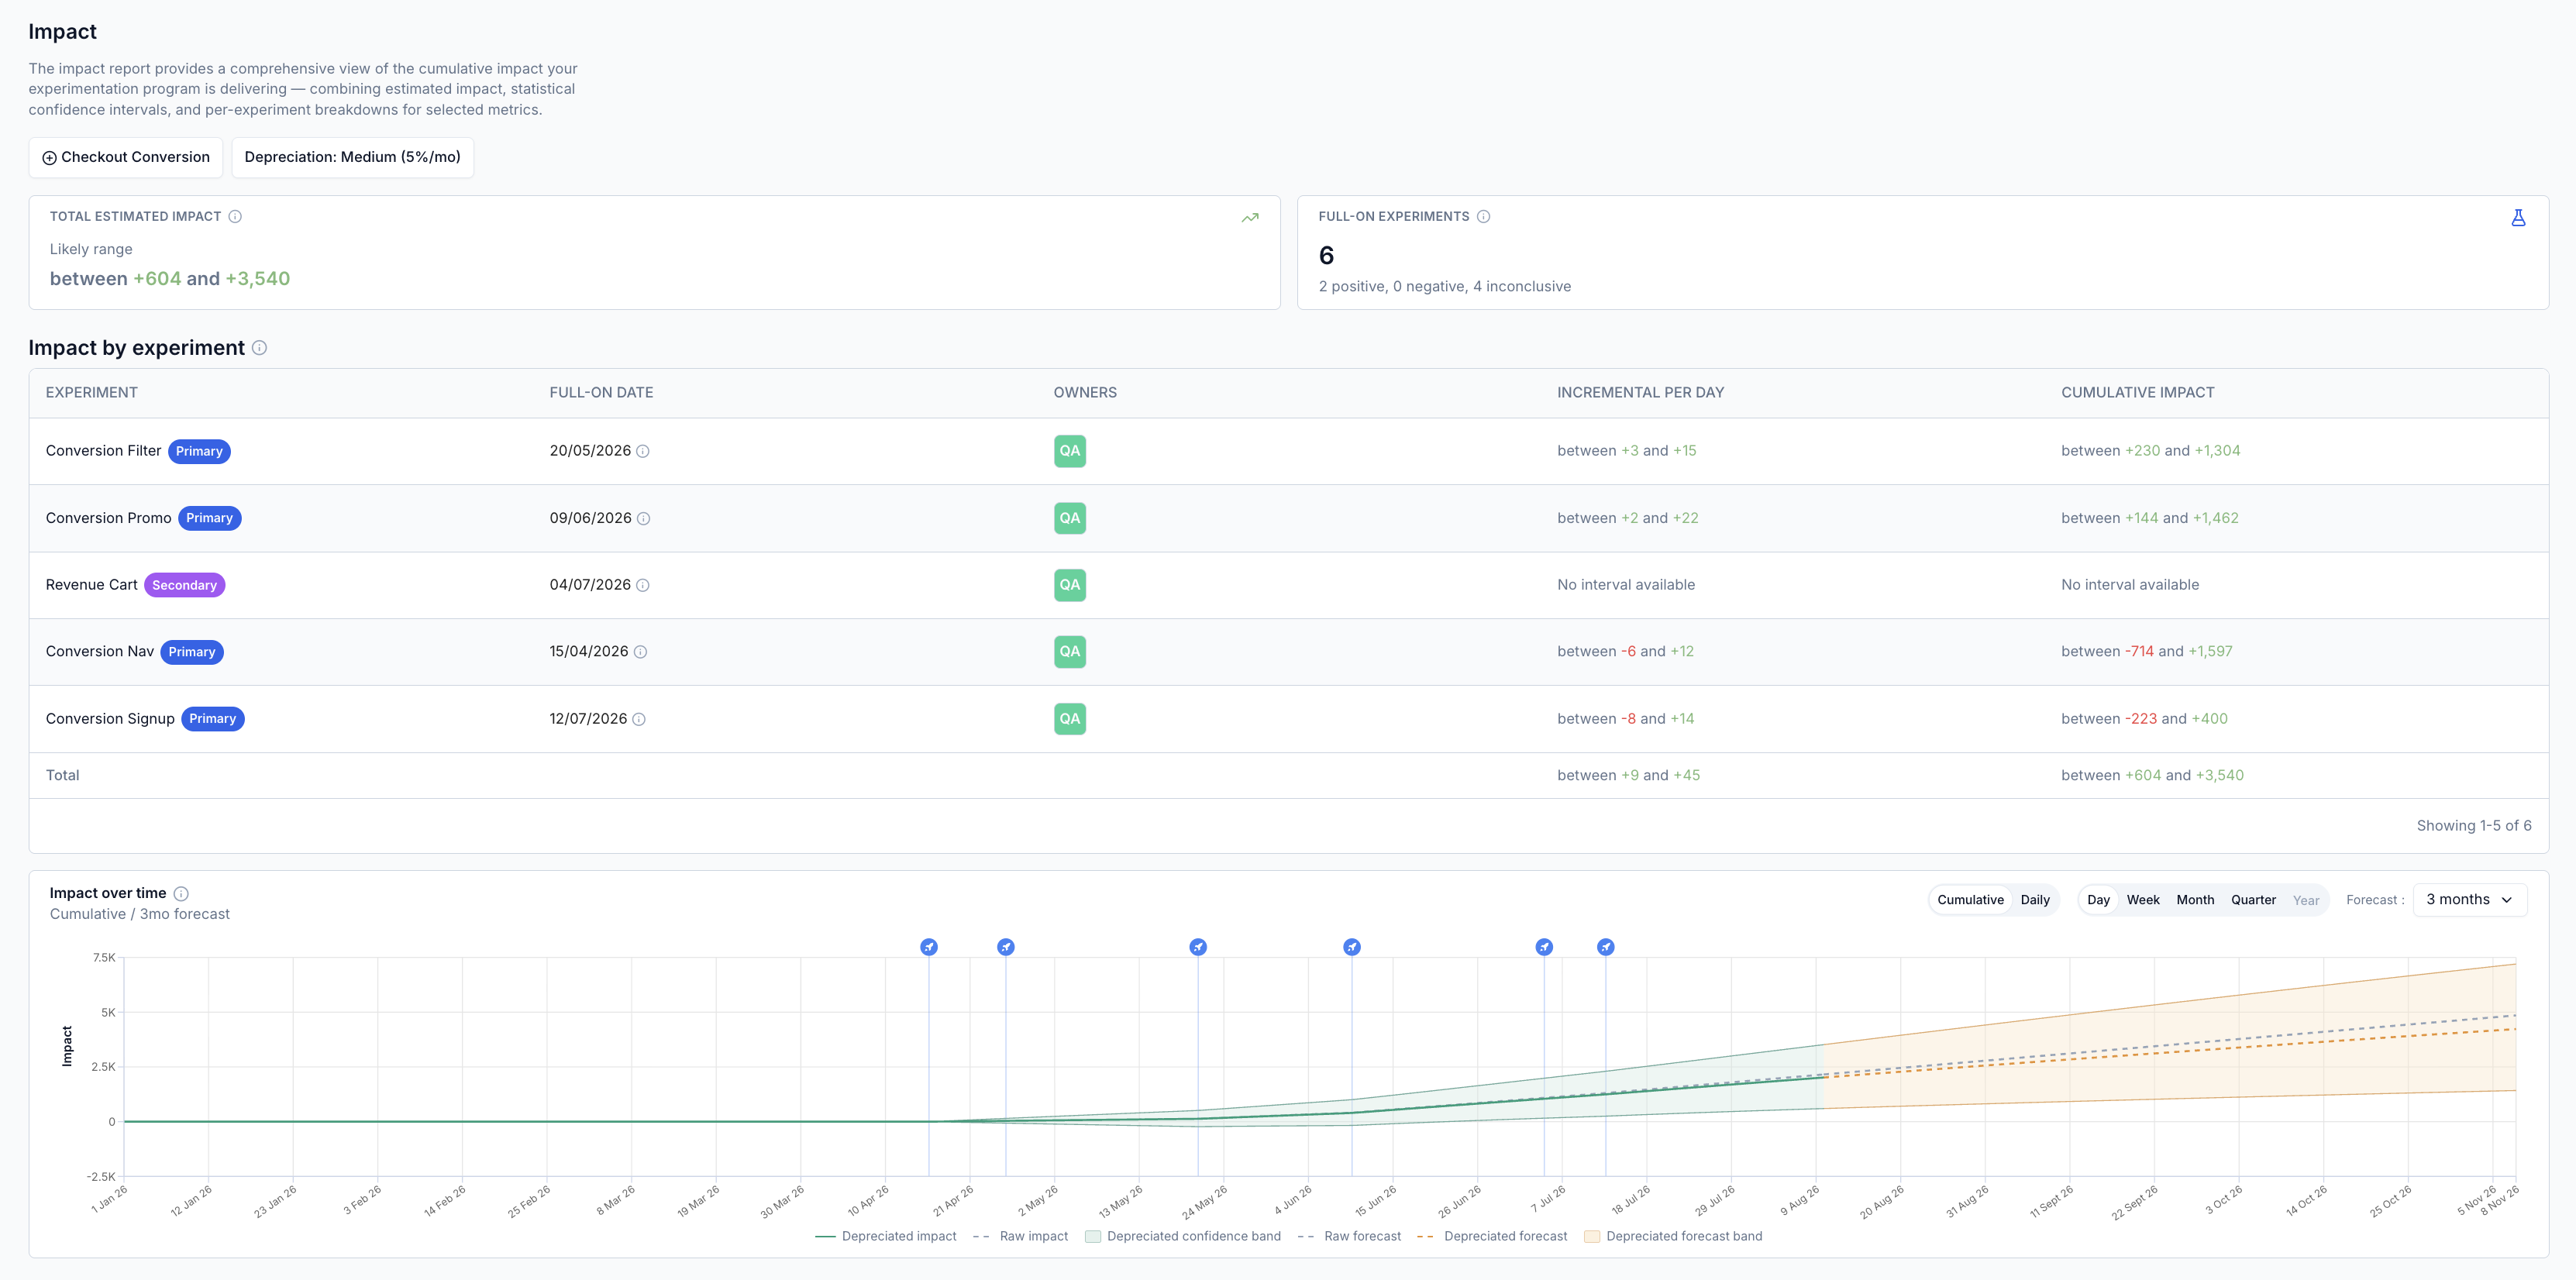
The Impact report provides a view of the cumulative impact your experimentation programme is delivering.
Where the Velocity report counts experiments and the Decisions report records what was decided,
the Impact report estimates what those decisions were actually worth, combining estimated impact, statistical confidence intervals and per-experiment breakdowns for a selected metric.
The report only includes experiments which were put Full on in the reporting period.
An experiment which was completed but where the decision was to Keep current contributes no impact, since the tested change was never rolled out.
Impact figures are estimates, not measured revenue. They extrapolate the effect observed during the experiment forward over time, which assumes the effect persists after roll-out. Use the depreciation setting to reflect how quickly you believe that effect fades.
Permissions
Access to the impact report requires the permission Experiment reports > View impact.
If you wish to access the report but do not have permissions please reach out to your platform admin so they can grant you access.
Metric selection
The report is calculated for one metric at a time, selected using the metric picker at the top of the report. Impact can only be estimated for metrics where an absolute difference is meaningful, so the picker lists the metrics available for the experiments in the reporting period.
Depreciation
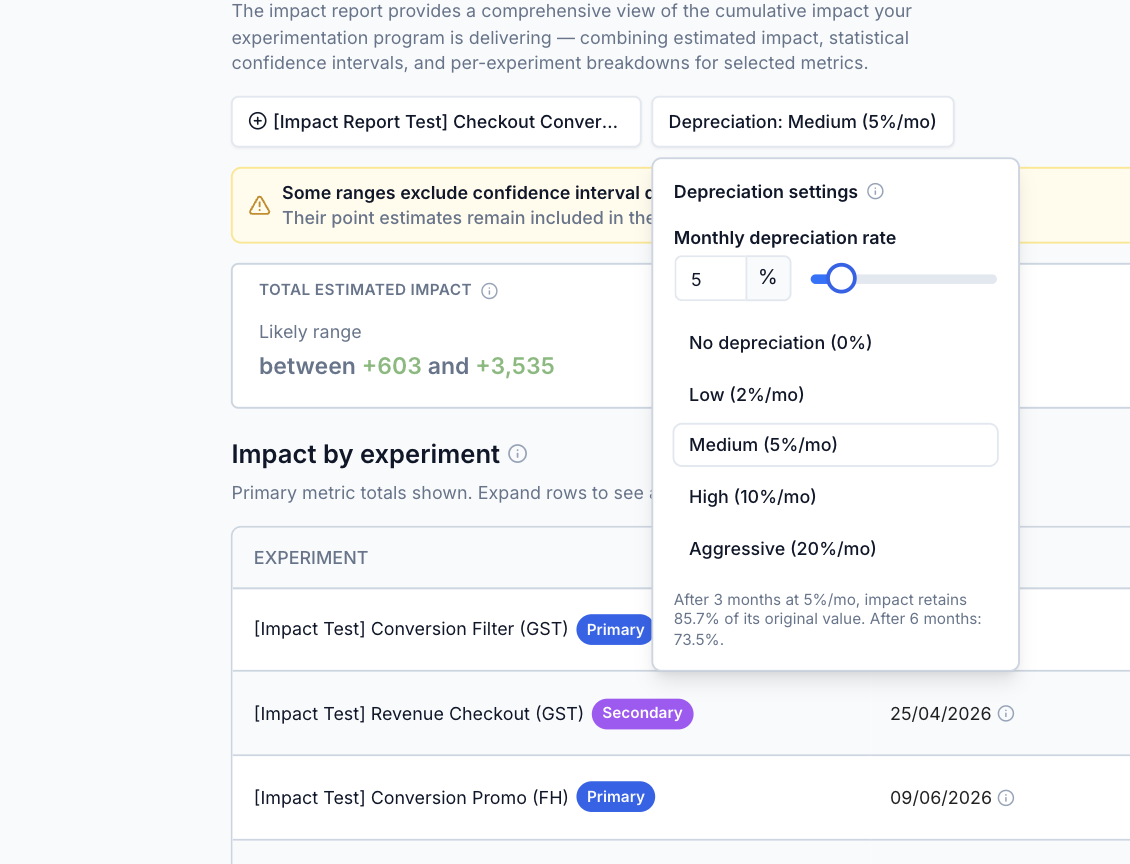
An experiment measures an effect over a short window, but that effect rarely persists unchanged forever.
Novelty wears off, competitors respond, and the baseline experience moves on.
The Depreciation setting applies a monthly decay to the estimated impact so the cumulative total reflects that fade.
The following presets are available, and the rate can also be set to any value using the slider or input field:
| Preset | Monthly rate |
|---|---|
| No depreciation | 0% |
| Low | 2%/mo |
| Medium (default) | 5%/mo |
| High | 10%/mo |
| Aggressive | 20%/mo |
The panel shows what the selected rate means over time. At the default 5%/mo, impact retains 85.7% of its original value after 3 months and 73.5% after 6 months.
Depreciation affects the totals, the per-experiment breakdown and the chart. The raw, undepreciated figures remain visible on the Impact over time chart for comparison.
Total estimated impact
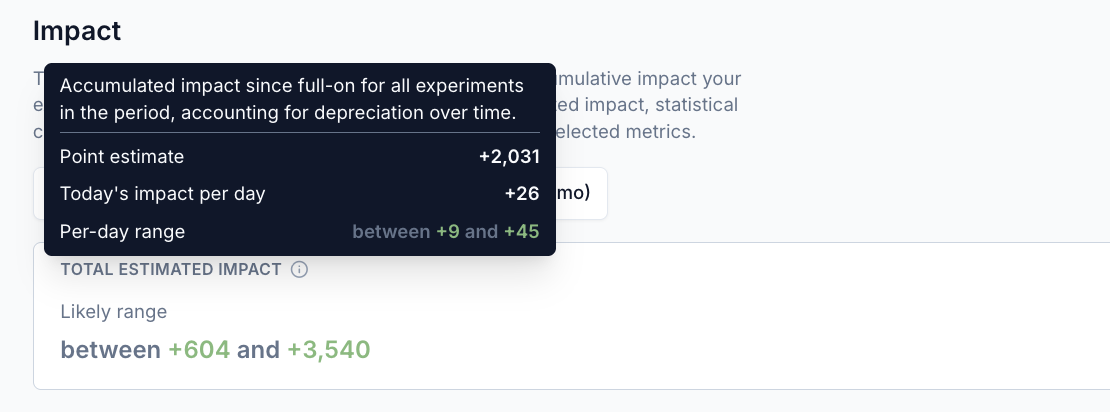
This widget shows the accumulated impact since Full on for all experiments in the reporting period, accounting for depreciation over time.
The headline figure is a Likely range rather than a single number, reflecting the statistical uncertainty of the underlying experiments.
Hovering over the widget reveals the detail behind it:
- Point estimate: the central estimate of the accumulated impact
- Today's impact per day: the rate at which impact is currently accruing
- Per-day range: the confidence interval around that daily rate
Full on experiments
This widget counts the experiments put Full on in the reporting period which contribute to the report, broken down by the direction of their result: how many were positive, how many negative and how many inconclusive.
An inconclusive experiment is one where the confidence interval spans zero, so the data cannot tell whether the change helped or hurt. Inconclusive experiments are still included in the totals, because their point estimate remains the best available estimate of their effect.
Impact by experiment
The Impact by experiment table breaks the total down to the individual experiments contributing to it, so a headline figure can be traced back to its source.
Each row shows the impact of the metric selected at the top of the report. A badge next to the experiment name indicates whether that metric was the Primary or a Secondary metric for that particular experiment.
The table shows the following columns:
| Column | Description |
|---|---|
Experiment | The experiment name, tagged to show whether the selected metric was Primary or Secondary for that experiment |
Full on date | The date the experiment was put Full on, from which its impact starts accruing |
Owners | The experiment owners |
Incremental per day | The range of impact the experiment is currently contributing per day |
Cumulative impact | The range of impact accumulated since the Full on date |
A Total row aggregates all experiments, matching the Total estimated impact widget.
Experiments with no confidence interval data for the selected metric show No interval available in place of a range.
A cumulative impact range spanning zero, shown with a negative lower bound and a positive upper bound, means the experiment cannot be said to have helped or hurt with confidence. This is a normal and expected outcome, particularly for experiments which completed without a significant result on the selected metric.
Impact over time
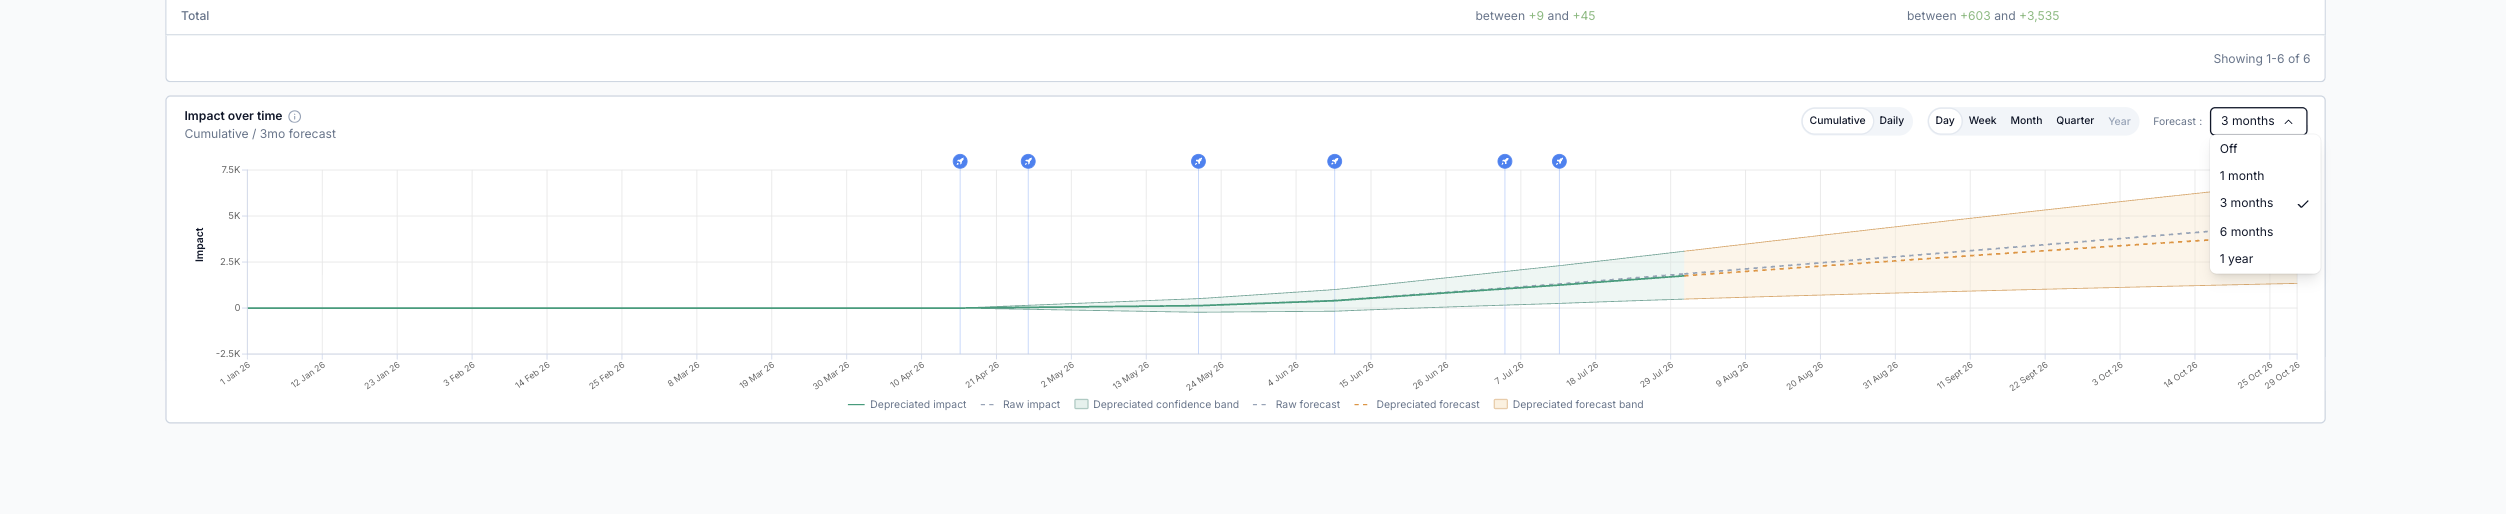
The Impact over time chart plots how impact has accumulated across the reporting period, and optionally projects it forward.
Markers along the top of the chart indicate the point at which each experiment was put Full on, showing which roll-outs drove which movements in the line.
Chart controls
- Cumulative / Daily: Switches between total impact accumulated to date and the impact contributed on each individual day
- Day / Week / Month / Quarter / Year: Sets the granularity at which points are plotted
- Forecast: Projects the trend forward by
1 month,3 months,6 monthsor1 year, or turns the projectionOff
Reading the chart
The chart distinguishes measured impact from projected impact, and depreciated figures from raw ones:
| Series | Meaning |
|---|---|
Depreciated impact | Accumulated impact to date, with depreciation applied |
Raw impact | Accumulated impact to date, without depreciation |
Depreciated confidence band | The confidence interval around the depreciated impact |
Raw forecast | Projected impact without depreciation |
Depreciated forecast | Projected impact with depreciation |
Depreciated forecast band | The confidence interval around the depreciated forecast |
Hovering over any point on the chart shows the values behind it for that date, including the upper bound, the estimate with depreciation, the lower bound and the raw figure.
The forecast is an extrapolation of the trend to date under the selected depreciation rate, not a prediction that accounts for seasonality, planned changes or market conditions. The widening band around the forecast reflects that uncertainty compounds the further ahead it projects.